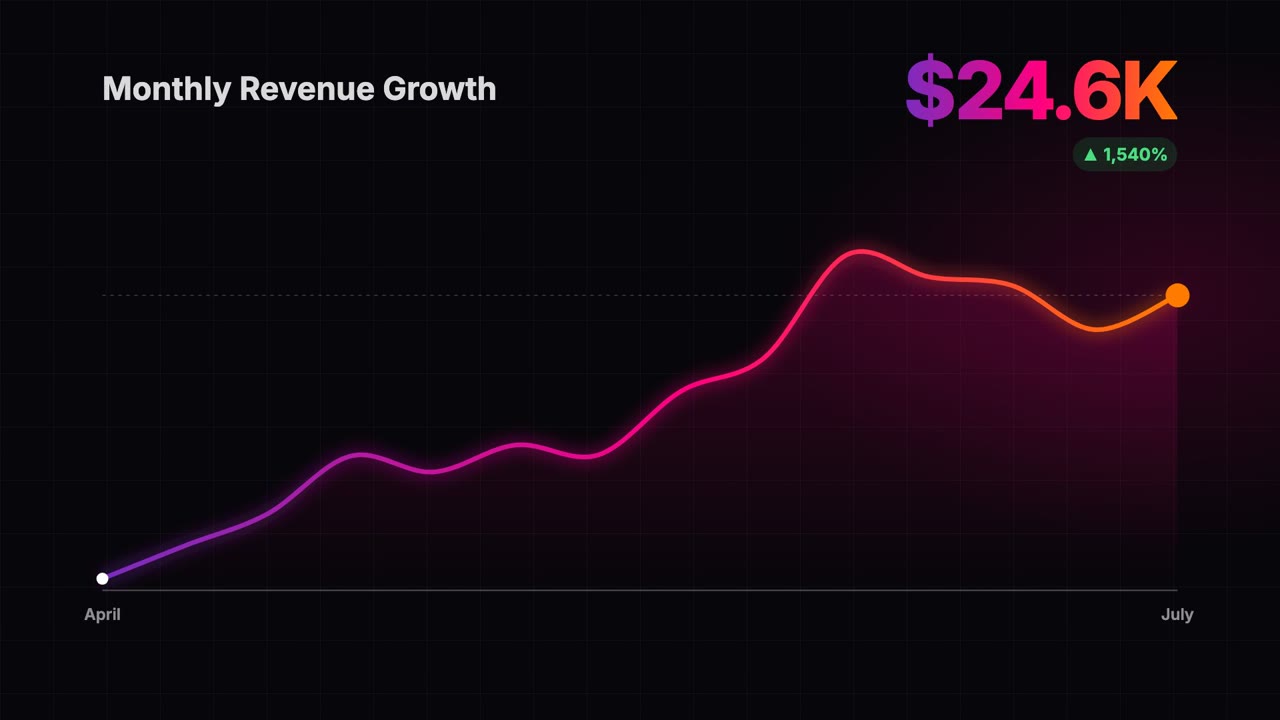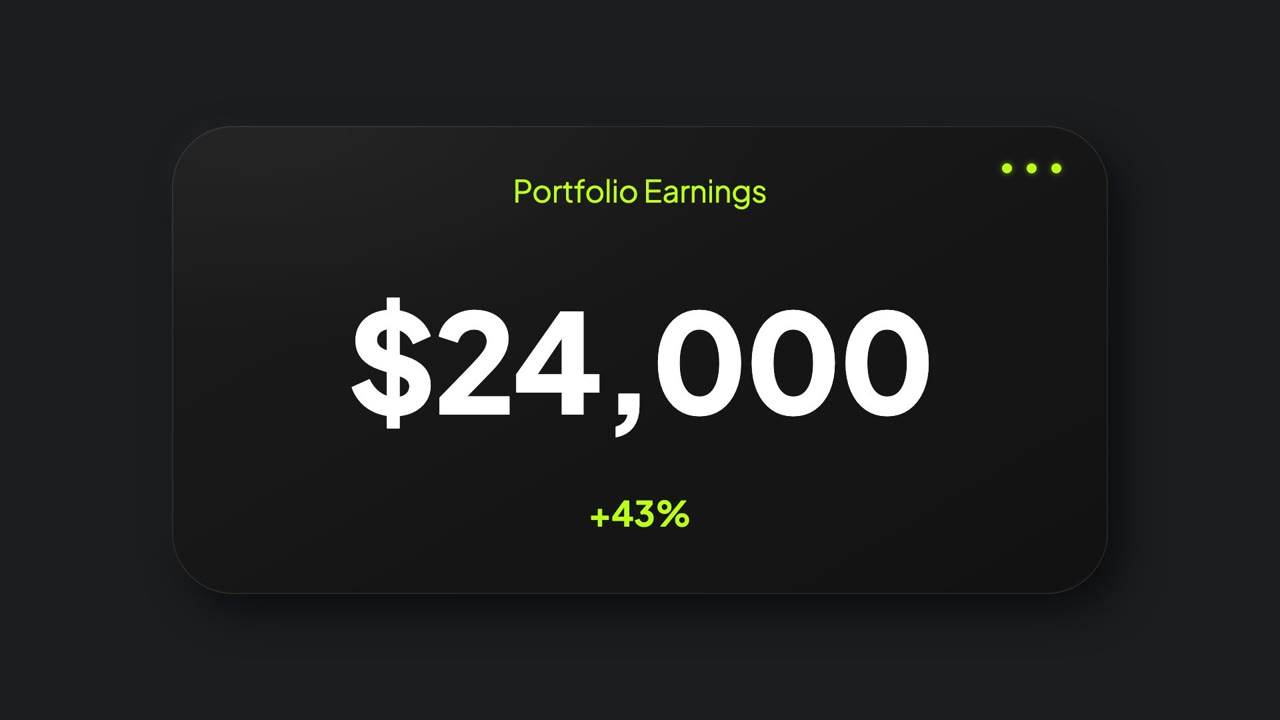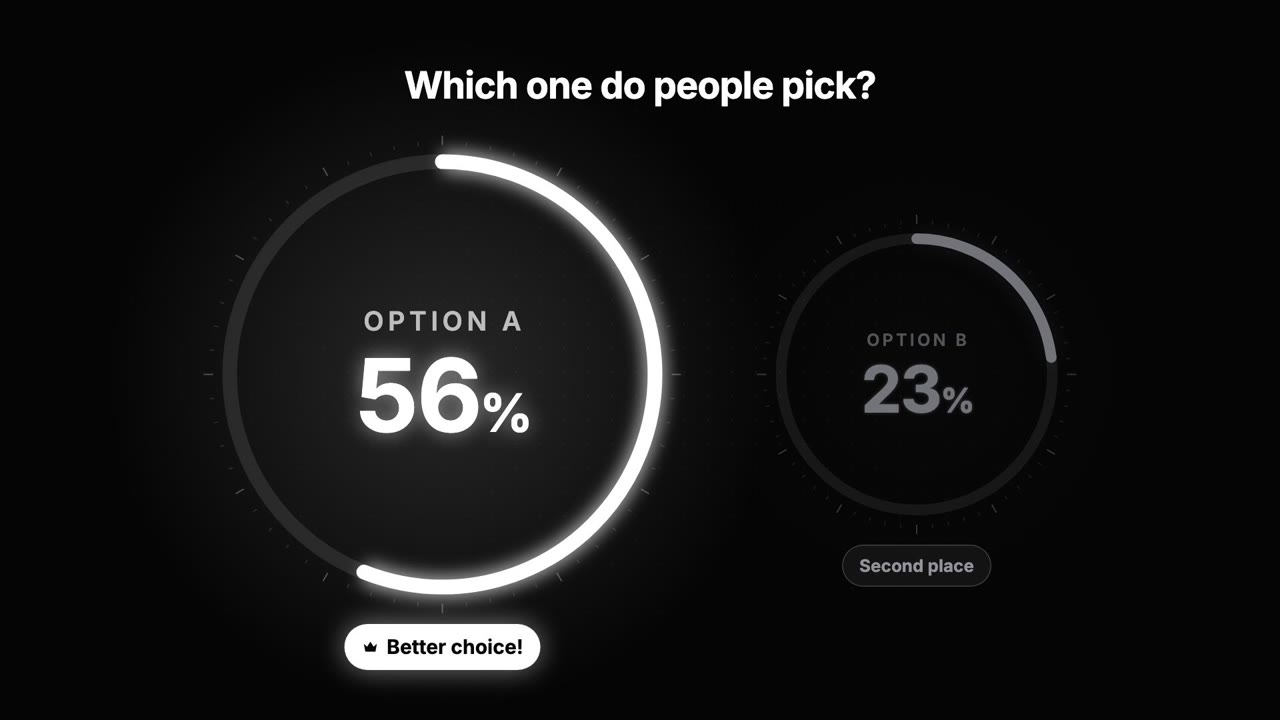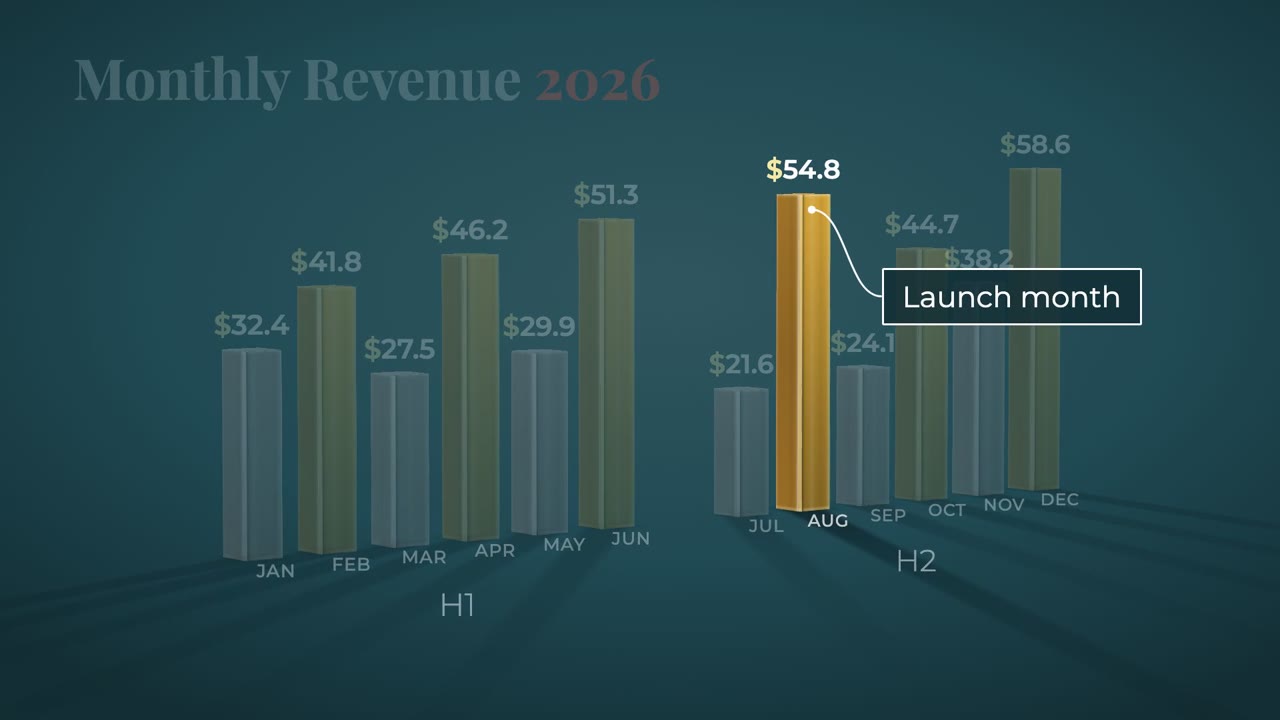
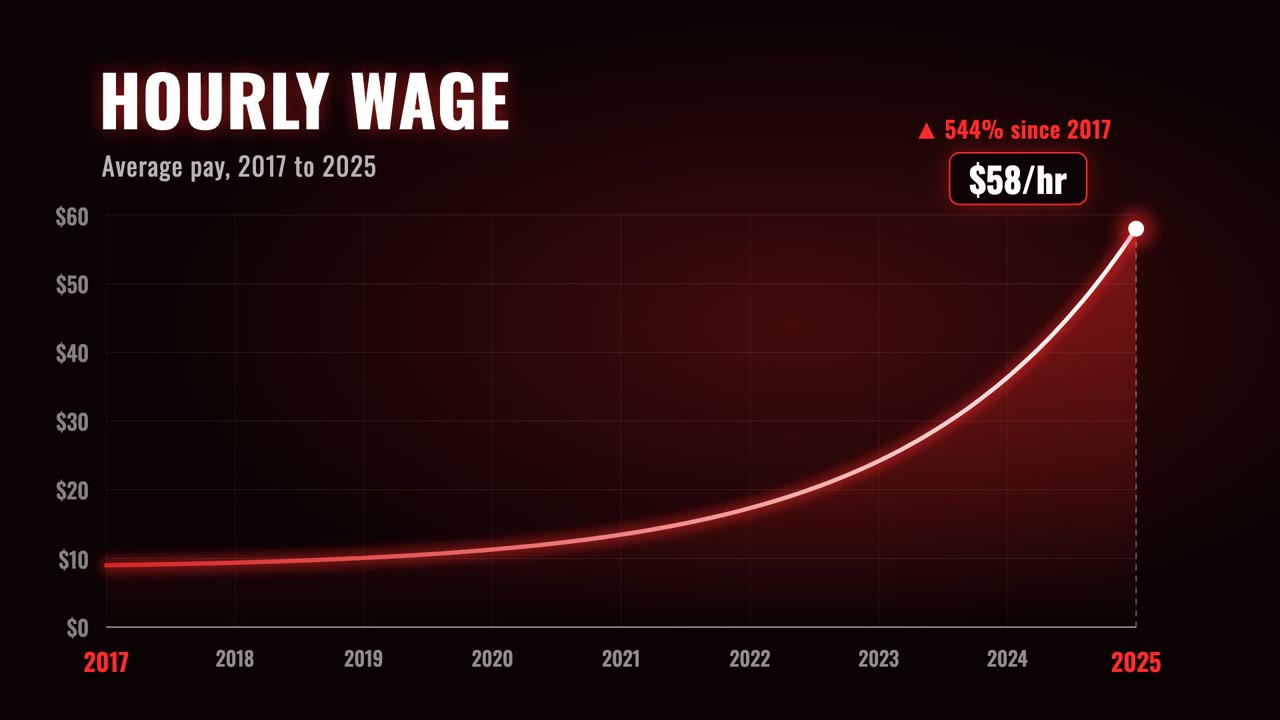
Here the red neon curve creeps along almost flat, then bends sharply upward while a value tag rides the tip ($10/hr, $18/hr, $39/hr, $55/hr). The dark red grid, axis labels and headline are all editable, and so is the data. Good for finance explainers, YouTube essays and pitch decks that need to show something compounding.
- Duration
- 15 seconds
- Size
- 1920 × 1080
- Used by
- 85 creators
Free to use: edit in your browser and export an MP4 with no watermark on the free plan, available in the US, Canada, the UK, Europe and other supported countries.