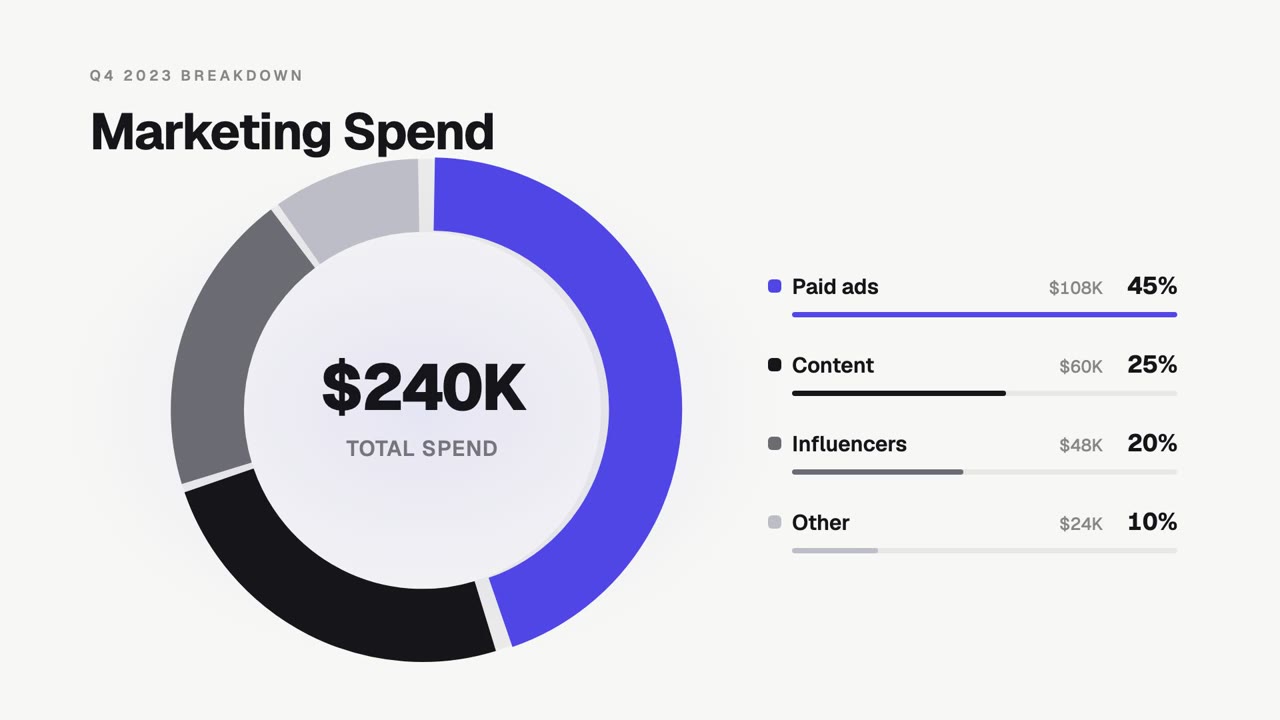
A donut chart on a light background fills one segment at a time while the total in the center counts up, a legend with amounts and percentages builds on the right, then each slice gets its own spotlight. Change the categories, values, title and colors. Fits budget breakdowns, pitch decks and marketing reports.
- Duration
- 15 seconds
- Size
- 1920 × 1080
- Used by
- 5 creators
Free to use: edit in your browser and export an MP4 with no watermark on the free plan, available in the US, Canada, the UK, Europe and other supported countries.